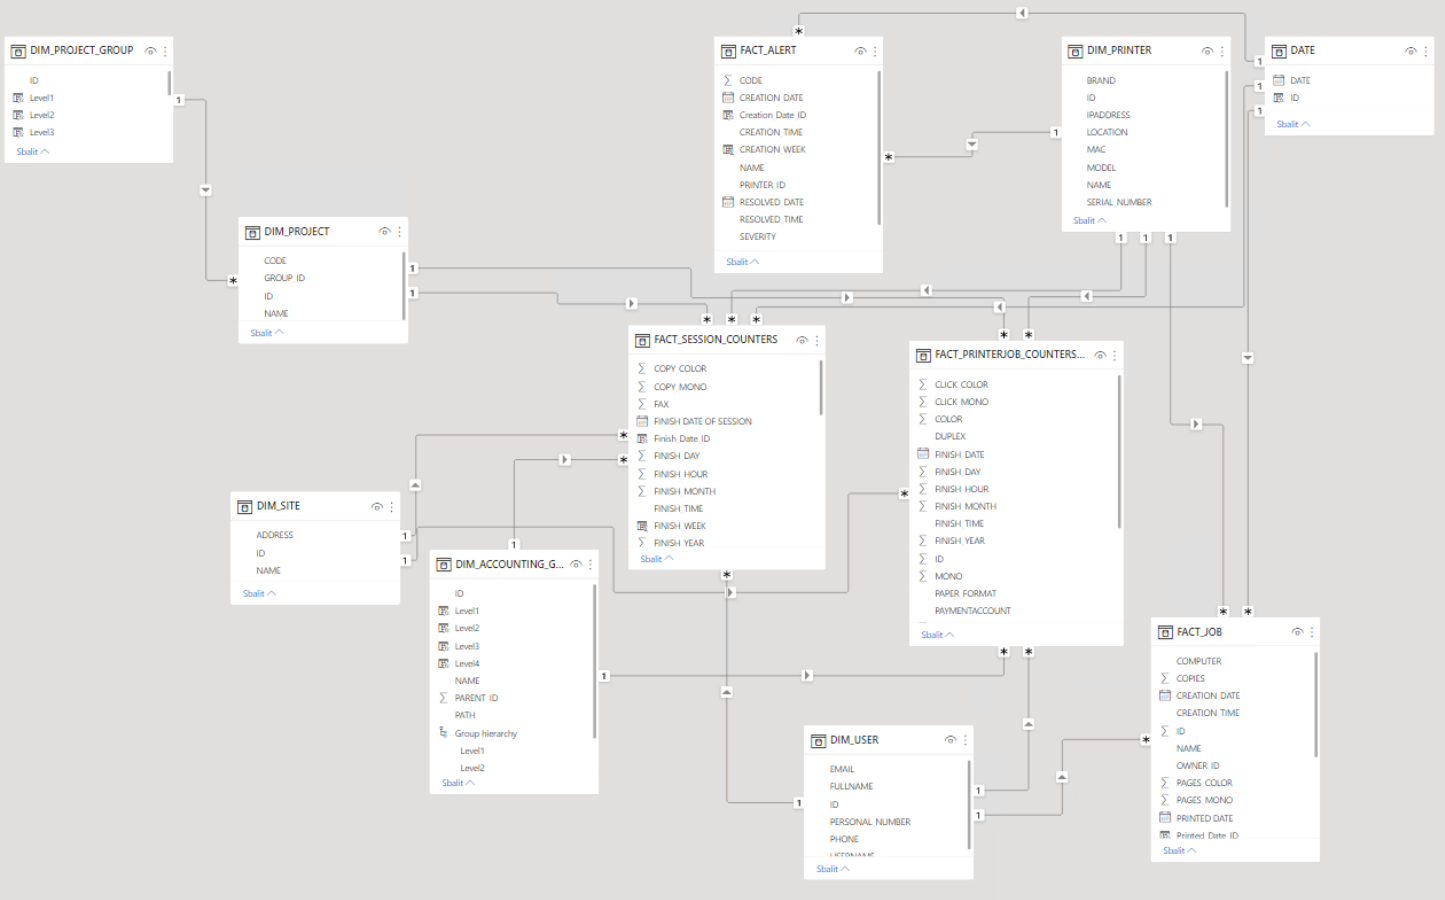
To manually create the reports, open Power BI and:
-
Establish the connection to your database:
-
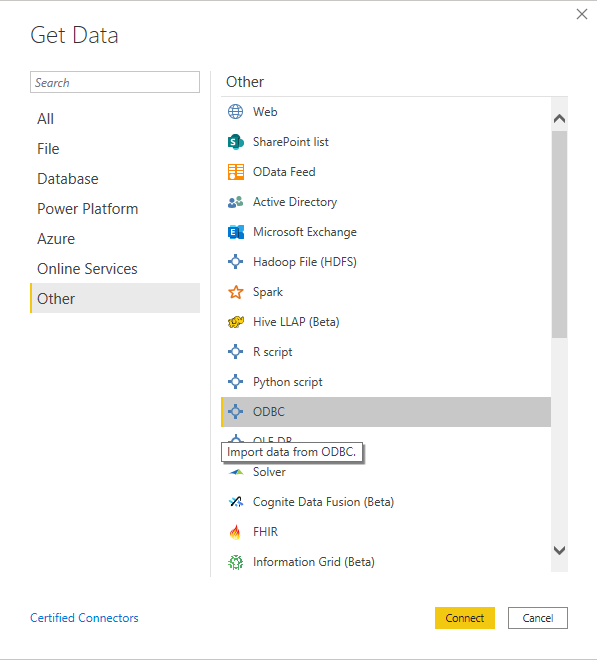
Click Get data, More.... In the new window, select Other, click on ODBC on the list, and click Connect. In the new prompt, select the Data source name (DSN) you created in the ODBC Data Sources app and click OK.
-
-
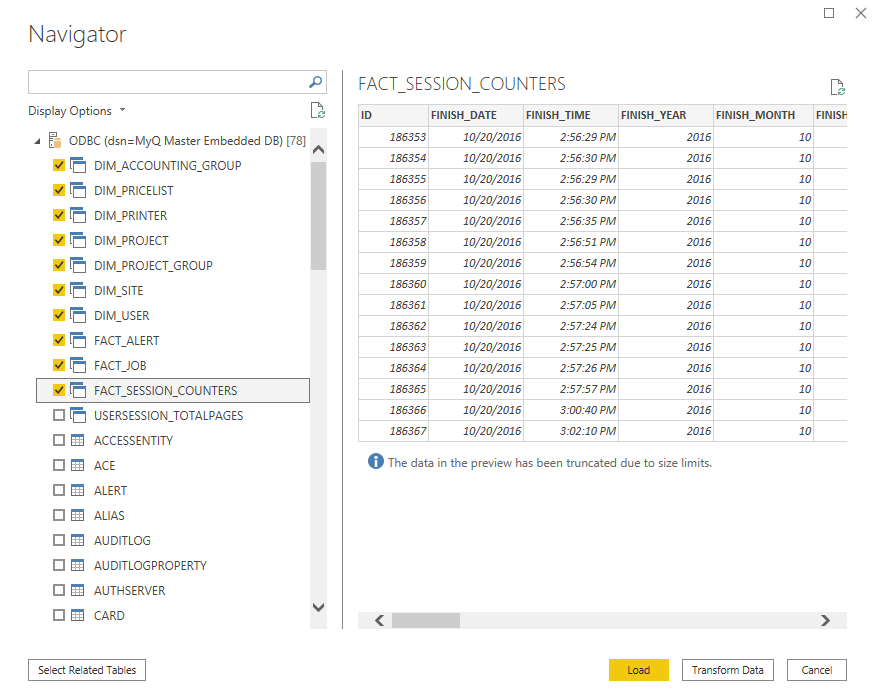
In the Navigator window, select all the options with the DIM_ and FACT_ prefixes and click Load (see Database Views and Dimensions).
-
Power BI loads the data, however the relationships between them must be created manually, since Power BI cannot extract them:
-
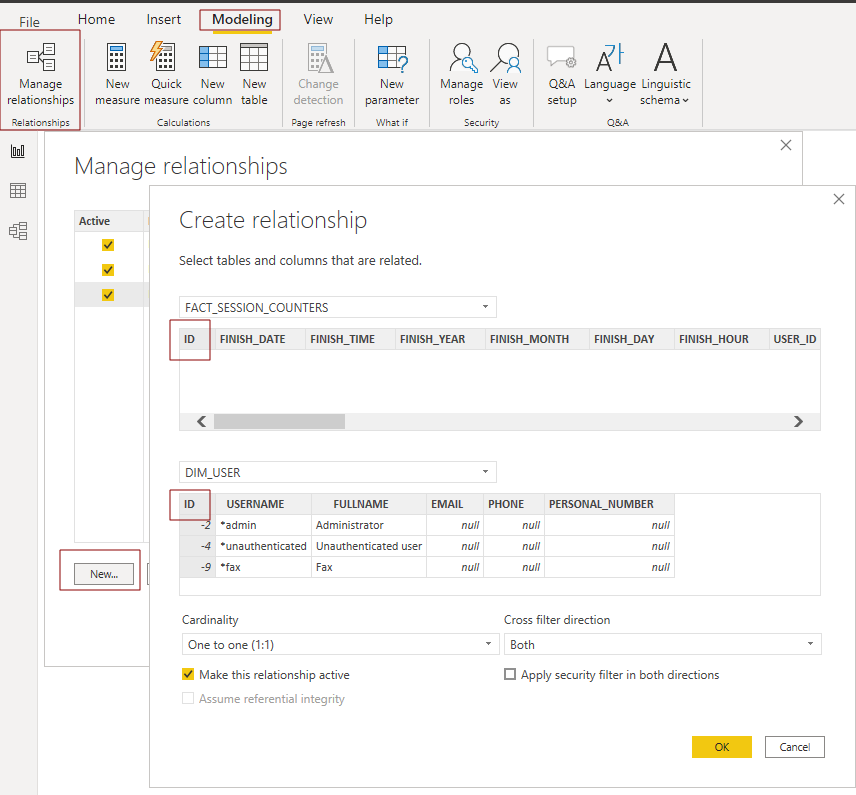
Go to the Modeling menu and click on Manage relationships.
-
Click New... and create the relationships between the views, selecting the IDs in each of them. Click OK once done.
-
-
Your model has been created and you can add visualizations to the report.