
When you are creating reports on the Reports main tab, you can choose from a large number of built-in report types that are sorted into multiple categories. Some of the types are included in more categories (for example, Groups: Daily Summary, Print Jobs: Daily Summary, etc.), while some of the types are particular to only one category (for example, Device Alerts in Alerts Maintenance or Credit Balance in Credit & Quota).
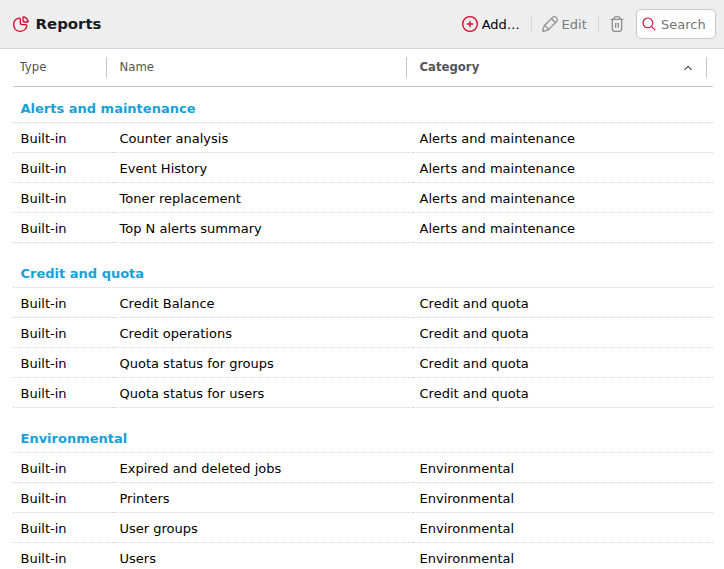
To see an overview of all the report types and categories, go to MyQ > Settings > Reports.
Granting Users Rights to Use a Report
The administrator can run all the built-in reports and provide other users and groups with rights to run them as well. In MyQ > Settings > Reports, right-click on a report and click Edit. On the General tab, in the Permission for running the report field, choose users and groups from the list and click Save.
You can also add custom report types developed by the MyQ development team. To do so, just click +Add, upload the custom report definition file, select users or groups to access it, and click OK. For more information about custom report types, please contact MyQ support.
Report Categories
Each category below lists its reports in a table. In the tables:
-
Charts: Yes means that charts are available for the report.
-
Aggregated Columns: Yes means that the report supports aggregated columns.
-
Job Privacy: Not available means that the report is not available when Job Privacy is enabled. Excludes user data means that the report can be used when Job Privacy is enabled, but it excludes user-specific information.
-
In the Counters by Function reports, the function field refers to whether a page was printed or copied.
Reports marked as BETA only contain data from Embedded Terminals running MyQ 8+. If some of your Embedded Terminals run earlier versions of MyQ, their data will not be included in the report.
Alerts and Maintenance Reports
Alerts and Maintenance reports provide information about device alerts and unusual changes on device counters.
|
Report |
Description |
Charts |
Aggregated Columns |
Job Privacy |
|---|---|---|---|---|
|
Counter Analysis |
Page counts per session, covering B&W pages, color pages, total pages, and scans by the user. It shows sessions where the counters reached or exceeded the predefined value. |
|
|
Not available |
|
Event History |
Occurrence of predefined device errors and alerts. It only shows alerts that are turned on in Settings > Events in the MyQ Web UI. |
|
|
|
|
Toner Replacement |
Toner usage, the date the toner was installed or replaced, and the pages printed for each toner container. The number displayed in the Toner replacement report in the Pages printed and Total counters columns depends on the toner it relates to:
|
|
|
|
|
Top N Alerts Summary |
Most common errors and alerts. The number of alerts shown can be customized. |
Yes |
|
|
Environmental Reports
Environmental reports provide information about the environmental impact of printing. They show estimates of environmental impact, in terms of how many tree-equivalents would be consumed, how much energy was used and how much carbon dioxide was emitted during the production of the paper used for printing and copying within your company's printing environment.
Data sources vary in their estimations. MyQ calculations in the report are based on the following data estimates:
-
Carbon dioxide for paper production: 12,7 gram per paper sheet
-
Energy used for production: 48 Wh per paper sheet or 32Wh for a recycled paper sheet
-
Trees: 8333 paper sheets are counted as 1 tree.
|
Report |
Description |
Charts |
Aggregated Columns |
Job Privacy |
|---|---|---|---|---|
|
Expired and Deleted Jobs |
List of expired/deleted jobs and the environmental impact of not printing them. They are sorted by print queue. |
|
|
Excludes user data |
|
Printers |
Environmental impact of each printer. |
|
|
|
|
User Groups |
Environmental impact of each User Group. |
|
|
|
|
Users |
Environmental impact of each User. |
|
|
Not available |
General Reports
General reports provide an overview of your MyQ system, such as total counters statistics and printing peaks or comparisons of price lists used for printers.
|
Report |
Description |
Charts |
Aggregated Columns |
Job Privacy |
|---|---|---|---|---|
|
Day of the Week |
Output volume by day of the week. |
Yes |
|
|
|
Hourly Activity |
Output volume by time of day. |
Yes |
|
|
|
Monthly Statistics |
Output volume by month. |
Yes |
|
|
|
Price List Comparison |
Price lists applied to various printer groups. |
|
|
|
|
Weekly Statistics |
Output volume by week. |
Yes |
|
|
Groups Reports
Groups reports contain information about group membership, printed pages, weekly stats etc.
|
Report |
Description |
Charts |
Aggregated Columns |
Job Privacy |
|---|---|---|---|---|
|
Counters by Function and Duplex (BETA) |
Counters per group by print/copy, color, and duplex. |
|
|
Not available |
|
Counters by Function and Paper Format (BETA) |
Counters per group by print/copy, color, and paper format. |
|
|
Not available |
|
Counters by Function Paper Format and Duplex (BETA) |
Counters per group by color, duplex, and paper format. |
|
|
Not available |
|
Daily Summary |
Summary of the daily output by group. |
|
|
|
|
Day of the Week |
Summary of the daily output based on the day of the week by group. |
|
|
|
|
Monthly Summary |
Summary of the monthly output by group. |
|
Yes |
|
|
Top N |
Groups sorted by largest output volume. It will show the top 5 by default, but this can be changed in the Design section of the report, under Filters and Parameters, by changing the number for N. |
Yes |
|
|
|
Total Summary |
Total output volume per group for a predefined period. |
|
Yes |
Not available |
|
User Group Membership |
List of members of the group and their membership options. |
|
|
Not available |
Print Jobs Reports
Print Jobs reports contain information about jobs printed in MyQ, such as the list of all expired and deleted jobs over a certain period.
Do not use Print Jobs reports for accounting purposes. Print Jobs reports display print jobs either as received by MyQ (for devices without an embedded terminal) or they reflect the printing parameters selected on the embedded terminal, rather than the final printed outcome.
|
Report |
Description |
Charts |
Aggregated Columns |
Job Privacy |
|---|---|---|---|---|
|
Daily Summary |
List of print jobs printed by user on a daily basis. |
|
|
Not available |
|
Expired and Deleted Jobs |
List of expired and deleted jobs. |
|
Yes |
Not available |
|
Favorite Jobs |
List of user's favorite jobs. |
|
|
Not available |
|
Printed Jobs Summary |
List of all the print jobs printed by the user for a predefined period. |
|
|
Not available |
Printers Reports
The following reports are included in the Printers category:
|
Report |
Description |
Charts |
Aggregated Columns |
Job Privacy |
|---|---|---|---|---|
|
Counters by Function and Duplex (BETA) |
Counters per device by print/copy, color, and duplex. |
|
|
Not available |
|
Counters by Function and Paper Format (BETA) |
Counters per device by print/copy, color, and paper format. |
|
|
Not available |
|
Counters by Function Paper Format and Duplex (BETA) |
Counters per device by color, duplex, and paper format. |
|
|
Not available |
|
Daily Summary |
List of print jobs printed by device on a daily basis. |
|
Yes |
|
|
Day of the Week |
Summary of the daily output based on the day of the week by device. |
|
Yes |
|
|
Meter Reading via SNMP |
Device’s total output volume. This report (unlike the rest of MyQ reports) includes accounting data of the jobs bypassing MyQ server. |
|
|
|
|
Monthly Summary |
Summary of the monthly output by device. |
|
|
|
|
Top N |
Printers sorted by largest output volume. |
Yes |
|
|
|
Total Summary |
Total output volume per printer for a predefined period. |
|
Yes |
Not available |
Projects Reports
Projects Reports contain information regarding projects and project accounting in MyQ, such as daily summary of projects or projects assigned to selected users over a certain period.
|
Report |
Description |
Charts |
Aggregated Columns |
Job Privacy |
|---|---|---|---|---|
|
Counters by Function and Duplex (BETA) |
Counters per project by print/copy, color, and duplex. |
|
|
Not available |
|
Counters by Function and Paper Format (BETA) |
Counters per project by print/copy, color, and paper format. |
|
|
Not available |
|
Counters by Function Paper Format and Duplex (BETA) |
Counters per project by color, duplex, and paper format. |
|
|
Not available |
|
Daily Summary |
List of print jobs printed by project on a daily basis. |
|
Yes |
|
|
Day of the Week |
Summary of the daily output based on the day of the week by project. |
|
Yes |
|
|
Monthly Summary |
Summary of the monthly output by project. |
|
Yes |
|
|
Print Jobs per Project |
List of print jobs assigned to each project. |
|
|
Not available |
|
Project Groups Total Summary |
Total output volume per project for a predefined period. |
|
|
|
|
Projects per User |
Output volume per user and project. The data is grouped by user. |
|
Yes |
Not available |
|
Top N |
Projects sorted by largest output volume. |
Yes |
|
|
|
User Project Assignment |
List of projects assigned to each user. |
|
|
Not available |
|
Users per Project |
Members of each project. |
|
Yes |
|
|
User Session Details |
List of all the user’s interactions on the device sorted by project. |
|
Yes |
Not available |
Users Reports
Users reports can contain various information about users, print jobs, credit statements, printed pages, and more.
|
Report |
Description |
Charts |
Aggregated Columns |
Job Privacy |
|---|---|---|---|---|
|
Counters by Function and Duplex (BETA) |
Counters per user by print/copy, color, and duplex. |
|
|
Not available |
|
Counters by Function and Paper Format (BETA) |
Counters per user by print/copy, color, and paper format. |
|
|
Not available |
|
Counters by Function Paper Format and Duplex (BETA) |
Counters per user by color, duplex, and paper format. |
|
|
Not available |
|
Daily Summary |
List of print jobs printed by user on a daily basis. |
|
|
Not available |
|
Day of the Week |
Summary of the daily output based on the day of the week by user. |
|
|
Not available |
|
Monthly Summary |
Summary of the monthly output by user. |
|
|
Not available |
|
Session Details |
List of all user's interactions on the device. |
|
|
Not available |
|
Top N |
Users, sorted by largest output volume. |
Yes |
|
Not available |
|
Total Summary |
Total output volume per user for a predefined period. |
|
|
Not available |
|
User Rights |
List of users with enhanced access rights. |
|
|
Not available |
|
Report |
Description |
Charts |
Aggregated Columns |
Job Privacy |
|---|---|---|---|---|
|
Servers – User Rights |
Rights assigned to users for each site server. |
|
|
|