Depending on your setup, you may see some of these options, while others are not accessible. If you are uncertain about which features you have access to, contact your administrator.
You can open the Reports overview tab either by clicking on Reports in the Quick links widget, or by clicking on the MyQ menu and selecting Reports. Here you can create and generate reports with a variety of data concerning your printing environment. Reports in MyQ are divided into two main categories:
-
My Reports
-
Shared reports
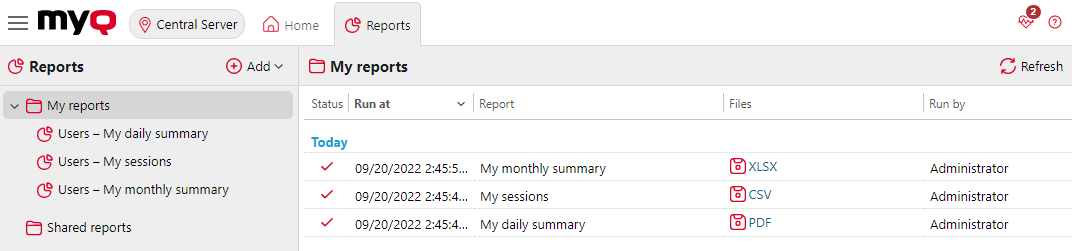
My Reports show you reports created by you, while Shared reports show you reports created by your administrator or by other users. There are three default reports:
-
My daily summary
-
My sessions
-
My monthly summary
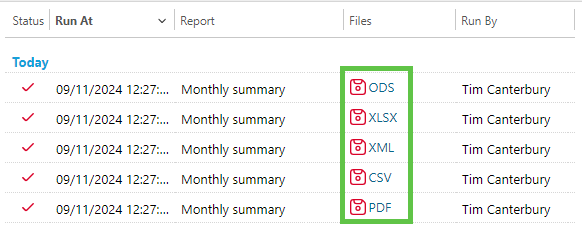
These are displayed in the Shared Reports folder and cannot be changed in any way, as they are managed by your administrator. Each report can be directly displayed on the web user interface and saved in any of the following formats:
-
PDF
-
CSV
-
XML
-
XLSX
-
ODS
The reports can be automatically generated and stored in a predefined folder. There is no data limitation for the generated report, it includes all the data from the specified period.
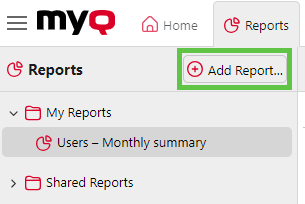
Creating a Report
You can create a new report in a few steps:
-
On the Reports main tab, click Add report… to display the Add report dialog box.
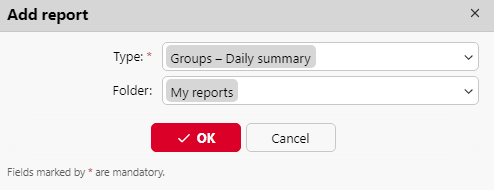
-
In the box, select the type of the new report and the folder to place it in, and then click OK. The editing panel of the new report opens. On the panel, edit and save the report.
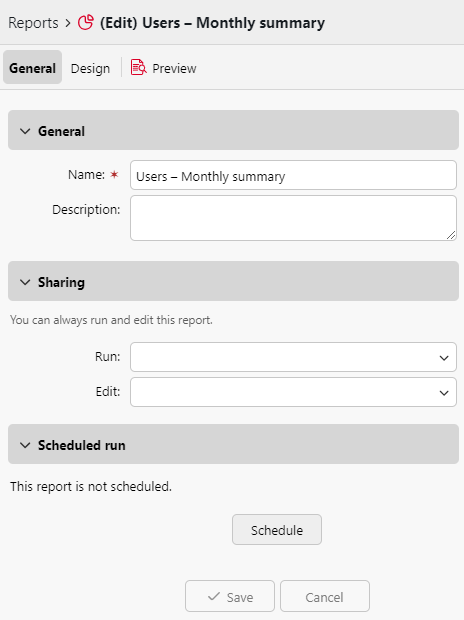
Editing a Report
-
On the General tab of the report's editing tab, you can change the report's Name, add a Description, and select Sharing rights (the users or groups who will have the rights to Run the report and those who will have the rights to Edit the report).
-
You can also click Schedule to set its scheduled run. Once done, click Design to open the Design tab of the report.
-
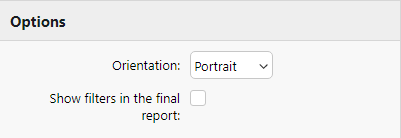
On the Design tab, you can set the report's layout, select the items (Users, Printers, etc.) to be included in the report, add or remove columns and change their order.
Options
-
Orientation: Select either the Portrait, or the Landscape orientation.
-
Show filters in the final report: Mark this checkbox if you want filters to be visible in the final report.
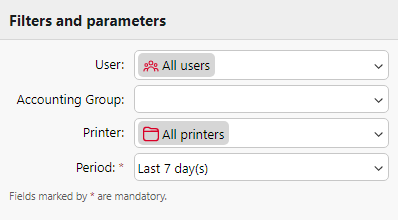
Filters and parameters
Available filters and parameters differ depending on the report type. These are the main parameters available for most of the standard report types:
-
User: Select the users to be included in the report. If you select the Me option and share this report with all users, each user can only see the data that concerns themselves; this way you can make personalized reports for each user.
-
Accounting Group: Select the accounting groups of users to be included in the report.
-
Printer: Select the printers to be included in the report.
-
Period: Select the time period to be covered by the report.
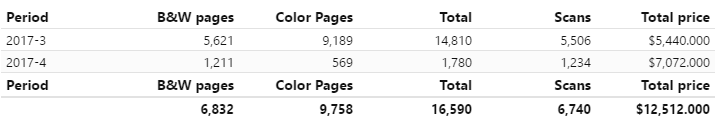
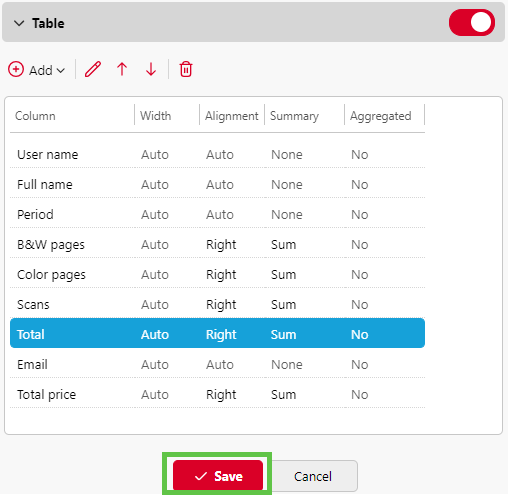
Table
Use the sliding white button at top right corner of the Table heading to enable or disable the Table option.
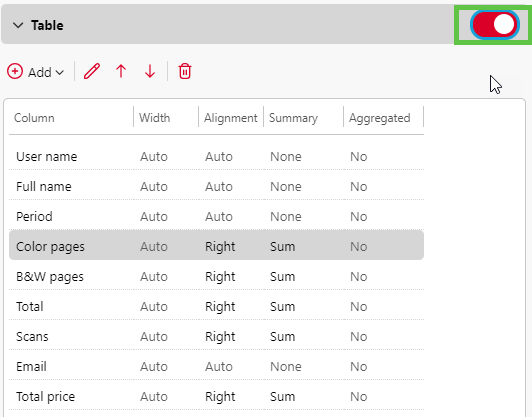
You can add and remove columns in the table, edit them and change their order. For each column, you can change the width, alignment and the type of summary that will be shown on the final (bottom) row (Sum, Average or None).
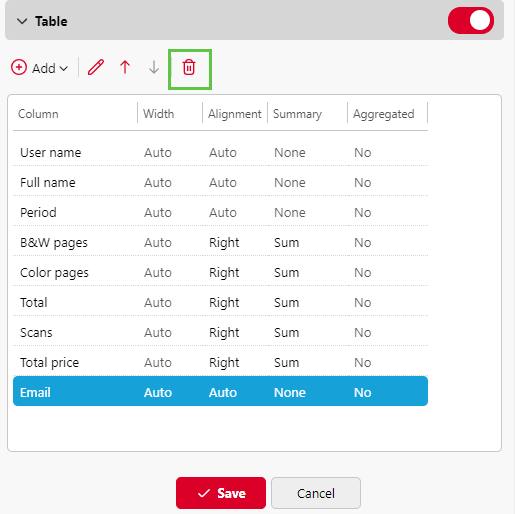
To add a new column, click Add. To open the editing options of an existing column, double-click it (or select it, and then click Edit). To remove a column, select it and click the Delete button. You can also right-click the column and select Delete.
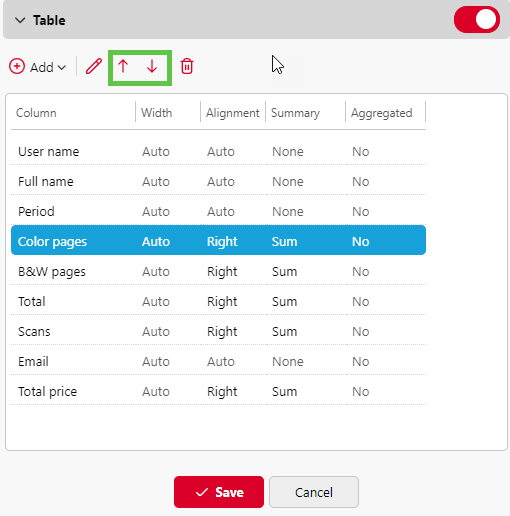
To move a row up or down the order, select it, and then click the up/down arrows to move the selection.
Some reports do not include the option to use tables, and their data can be displayed only in chart form. Designing your own reports can be complex, since it depends on many factors:
-
the amount of data included (columns)
-
the length of column names and values
-
the report’s orientation etc.
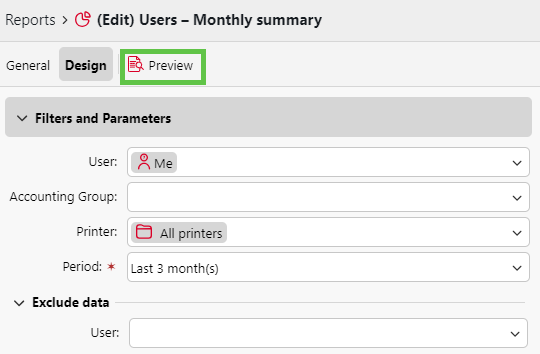
To get the best result, you can click Preview anytime during the report's creation to check what the new design will look like.
After the layout appears as required, click Save to save the table’s layout.
Generating Reports
To Preview a Report
Select the report and click Preview (or right-click it and click Preview on its shortcut menu). The report is shown in HTML format, and the number of included data records is limited. You can switch between Graphical view and Grid view.
To Run a Report
Right-click the report and click Run, then click the desired format. The format types include:
-
PDF
-
CSV
-
XML
-
XLSX
-
ODS
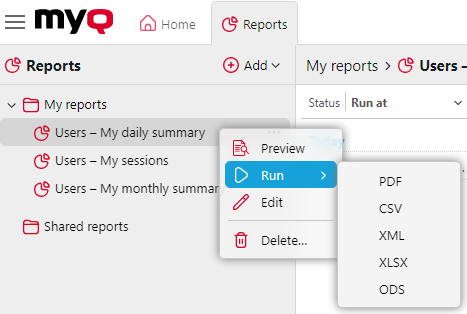
The report runs in the specified format without any data limitations.
To Export the Displayed Report
After the report is generated, click on the report’s format link in the file column to download it.