If you experience issues such as high CPU utilization, slow disk or network, or out-of-memory errors, the Windows Server application Performance Monitor can help you gather useful system information.
Performance Monitor is a Microsoft Management Console (MMC) snap-in that you can use to obtain system performance information. You can use this tool to:
-
Analyze the performance effects that applications and services have on a computer.
-
Obtain an overview of system performance.
-
Collect detailed information for troubleshooting.
Sharing Performance Monitor reports with MyQ Support can help us resolve your issue faster.
We strongly recommend to use the System Diagnostics data collector template. This template selects objects and counters that report the status of hardware resources, system response times, and processes on the local computer, along with system information and configuration data.
Run System Diagnostics Using the Template Data Collector:
-
Log in as an administrator to the Windows Server where your MyQ server runs.
-
On the Windows taskbar, select Start > Run.
-
In the Run dialog box, type
perfmon, and then click OK. -
In Performance Monitor:
-
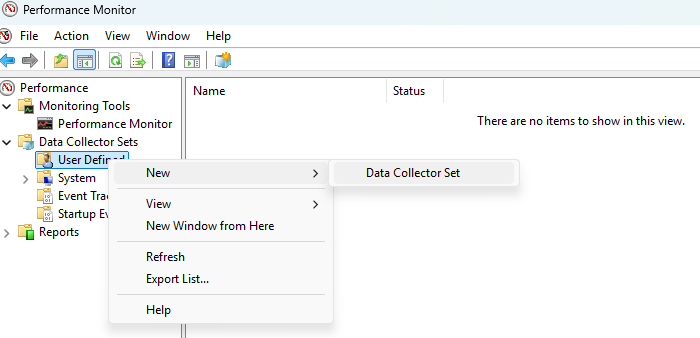
In the panel on the left, expand Data Collector Sets.
-
Right-click User-Defined and select New > Data Collector Set.
-
In the first Create new Data Collector Set wizard dialog box:
-
In the Name field type any descriptive name.
-
Select Create from a template (Recommended).
-
Click Next.
-
-
In the second Create new Data Collector Set wizard dialog box:
-
Select System Diagnostics.
-
Click Finish.
-
-
-
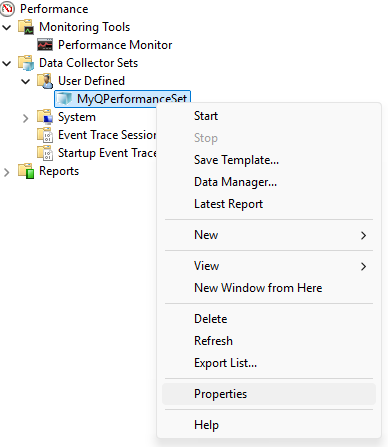
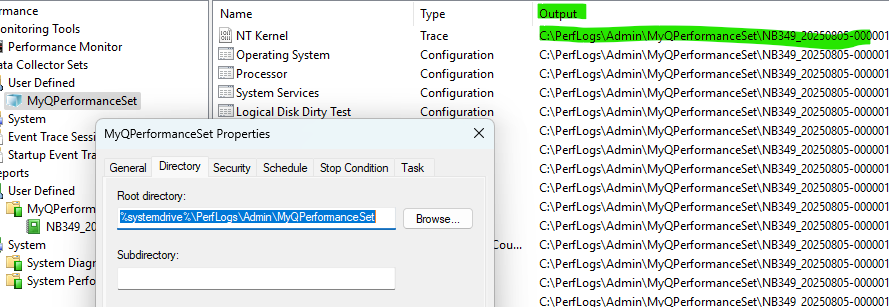
(Recommended) Change the properties of this user-defined data set. In particular, consider adjusting the Schedule and Stop Condition, to control the capture period and duration. Right-click the name, select Properties, and adjust as needed.
-
To start gathering performance information go to your data set, right-click the name and click Start.
-
To stop gathering performance information, go to your data set again, right-click the name, and click Stop.
-
To review the logged performance information, open Windows Explorer and locate and double-click the .blg file indicated in the Output column in the Performance Monitor.
Performance Monitor opens showing the collected data.
Gather all of the Output files (.blg, .xml, .etl, .log, .xsl, .xml, .html) and send them to the MyQ Support.
We recommend to create a ZIP file from the directory where these files are located.
Monitor VMs Running Windows Server
Server virtualization is widely used practice, and many organizations have migrated some or all their server workloads to virtual machines (VMs) that are running virtualization servers.
From a monitoring perspective, it's important to remember that servers running as guest VMs consume resources in the same way as physical host–server computers.
In addition to monitoring guest VMs, always remember that you must monitor the host that runs them.
For more information about performance monitoring and tuning, see
https://learn.microsoft.com/en-us/windows-server/administration/performance-tuning/hardware/
https://learn.microsoft.com/en-us/training/modules/monitor-windows-server-performance/