.png)
Creating New Aggregated Columns
For some types of reports, you can create any number of custom aggregated (summary) columns. An aggregated column can display either the sum or the average of a selection of any number of other columns available for the type.
To create a new aggregated column for a report:
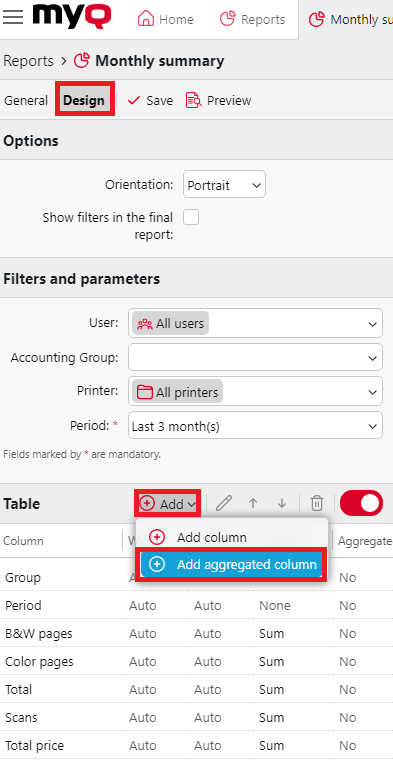
Go to MyQ, Reports. On the list of reports on the right side, select the report and click Edit on the ribbon (or right-click, edit). The report properties panel opens on the right side of the screen.
Go to the Design tab on the properties panel.
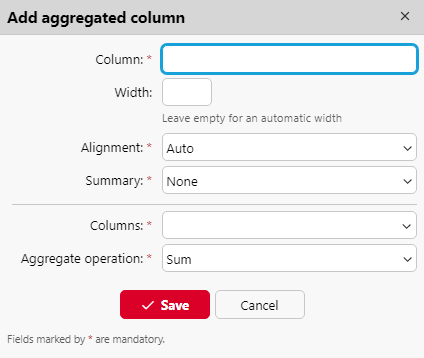
In the Table section, click +Add and select +Add aggregated column. The properties panel of the new column opens.
In the panel, set the columns properties, select the Aggregate operation you want to use (Sum or Average), and click Save. The new aggregated column is listed with the other table columns, and you can double-click on it to edit it.
Supported types of reports for aggregated columns
The aggregated (summary) columns can be created for the following types of reports:
From the Groups category: Monthly summary
From the Print jobs category: Expired and deleted jobs
From the Printers category: Daily summary, Day of the week, Meter reading via SNMP
From the Projects category: Daily summary, Day of the week, Monthly summary, Project groups total summary, Projects per user, Users per project.