.png)
Creating, Editing, and Cloning Reports
You can create a new report in a few steps:
At the top-right corner of the Reports main tab, click +Add report. The Add report dialog box appears.
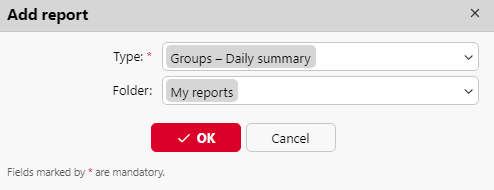
In the box, select the type of the new report and the folder to place it, and then click OK. The editing panel of the new report opens. On the panel, edit and save the report or simply close the panel to save the report without changes.
Editing a report
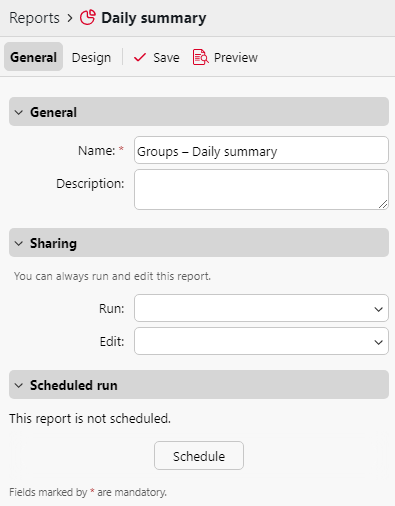
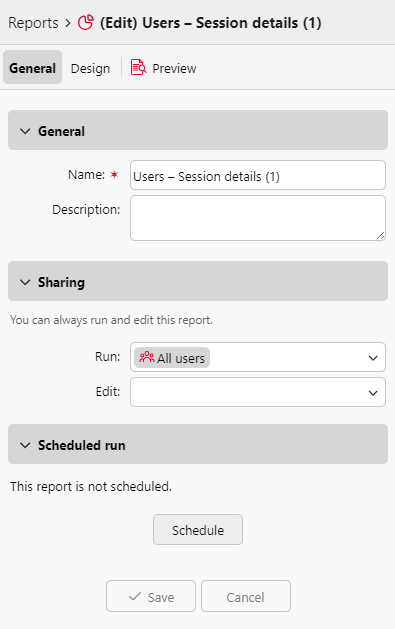
On the General tab of the report's editing tab, you can change the report's Name, add a Description, select Sharing rights, meaning the users or groups who will have the rights to Run the report and those who will have the rights to Edit the report. You can also click Schedule to set its scheduled run. Once done, click Design to open the Design tab of the report.
On the Design tab, you can set the report's layout, select the items (Users, Printers, etc.) to be included in the report, add or remove columns and change their order.
Options
Orientation: Select either the Portrait, or the Landscape orientation.
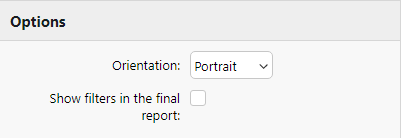
Show filters in the final report: Mark the checkbox if you want filters to be visible in the final report.
Filters and parameters
Available filters and parameters differ depending on the report type. These are the main parameters available for most of the standard reports types:
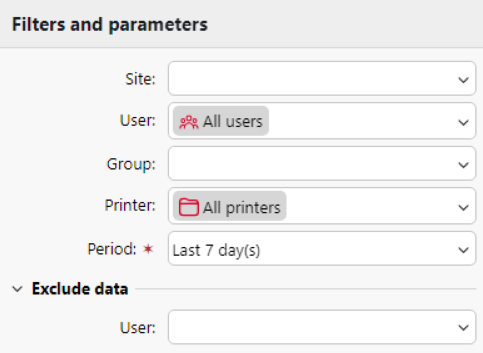
Site: Select the sites to be included in the report.
User: Select the users to be included in the report. If you select the Me option and share this report with all users, each user can only see just the data that concern themselves; this way you can make personalized reports for each user.
Accounting Group: Select the accounting groups of users to be included in the report.
Printer: Select the printers to be included in the report.
Period: Select the time period to be covered by the report.
Exclude data - User: Select the users to be excluded from the report (only available in reports where User is one of the filters used).
Table
Here you can enable and disable the table option.
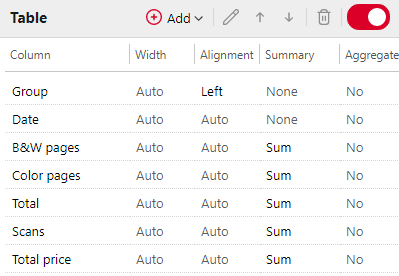
You can also add and remove columns to the table, edit them and change their order. For each column, you can change the width, alignment and the type of summary that will be shown on the final (bottom) row (Sum, Average or None).
To add a new column, click +Add. To open the editing options of an existing column, double-click it (or select it, and then click Edit). To remove a column, select it and click X. To move a column up or down the order, select it, and then use the up/down arrows.
Some reports do not include the option to use tables and their data can be displayed only in the chart form.
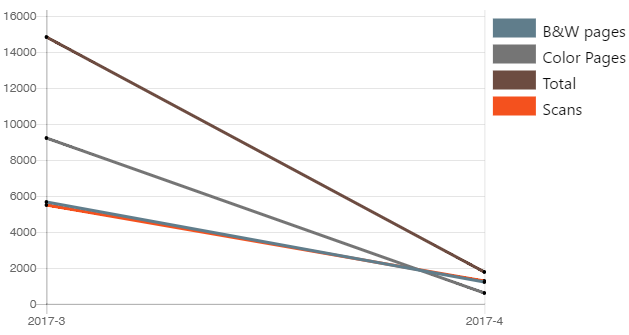
Chart
Here you can enable and disable the chart option.
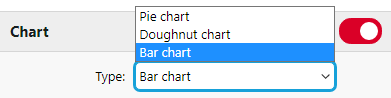
You can also select from the Bar, Pie and Doughnut chart types. Furthermore, you can add and remove data types to be shown on the chart and select colors for each data type (depending on the report type).
To add a data type, click +Add. To open editing options of a data type, double-click it (or select it, and then click Edit). To remove a data type, select it and click X. To move a data type up or down the order, select it, and then use the up/down arrows.
Some reports do not include the option to use charts and their data can be displayed only in the table form.
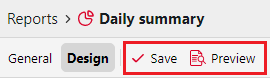
Designing your own reports can be a bit tricky, since it always depends on many factors - amount of data included (columns), length of column names and values, report orientation etc. To get the best result, you can click Preview anytime during the report's creation to check what the new design will look like. Only after you are satisfied with the layout, click Save to save the report.
Cloning Reports
Any user can clone an existing report that they have access to, this copies the settings of the existing report and saves it with a modified title, for example, the clone of Users - Session details is automatically named Users - Session details (1).
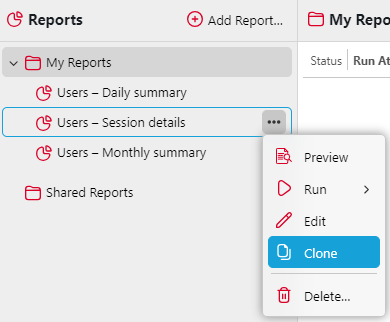
To clone a report, right-click its title or use its context menu and select Clone. The edit report options for the newly cloned report open automatically. Users can then change the title of the report or edit any other relevant settings and click Save. If a user does not edit any of the new report’s settings, the clone is already automatically saved.
If the source folder of the report was not created by the user, a clone will be created in the My Reports folder.