Reports tab
You can open the Reports overview tab either by clicking on Reports in the Quick links widget, or by clicking on the MyQ menu and selecting Reports.
Here you can create and generate reports with a variety of data concerning your printing environment, depending on the rights granted by your administrator.
Reports in MyQ are divided into two main categories: My Reports and Shared reports. My Reports show
you reports created by you, while Shared reports show you reports created by your administrator or by other users.
There are three default reports: My daily summary, My sessions and My monthly summary. These are displayed in the Shared Reports folder and cannot be changed in any way, as they are managed by your administrator.
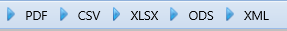
Each report can be directly displayed on the web user interface and saved in any of the following formats: PDF, CSV, XML, XLSX and ODS. The reports can be automatically generated and stored in a predefined folder. There is no data limitation for the generated report, it includes all the data from the specified period.
Creating a report
You can create a new report in a few steps:
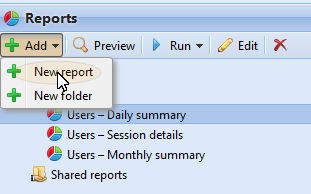
At the top-right corner of the Reports main tab, click +Add, and then click +New report. The New report dialog box appears.
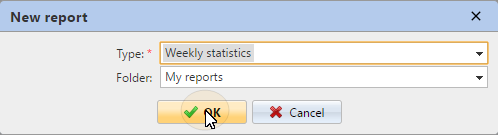
In the box, select the type of the new report and the folder to place it, and then click OK. The editing panel of the new report opens. On the panel, edit and save the report.
Editing a report
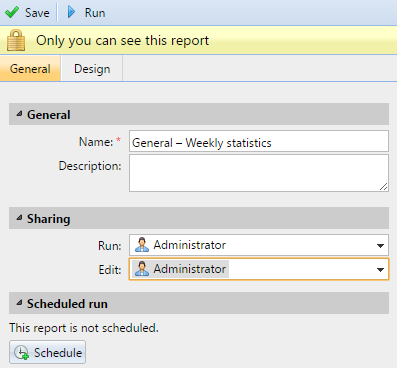
On the General sub-tab of the report's editing tab, you can change the report's Name, add a Description, select Sharing rights, meaning the users or groups who will have the rights to Run the report and those who will have the rights to Edit the report. You can also click Schedule to set its scheduled run. Once done, click Design to open the Design sub-tab of the report.
On the Design sub-tab, you can set the report's layout, select the items (Users, Printers, etc.) to be included in the report, add or remove columns and change their order.
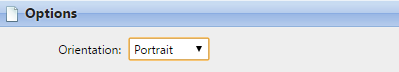
Options
Orientation: Select either the Portrait, or the Landscape orientation.
Filters and parameters
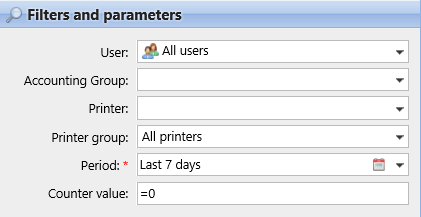
Available filters and parameters differ depending on the report type. These are the main parameters available for most of the standard reports types:
User: Select the users to be included in the report. If you select the Me option and share this report with all users, each user can only see just the data that concern themselves; this way you can make personalized reports for each user.
Accounting Group: Select the accounting groups of users to be included in the report.
Printer: Select the printers to be included in the report.
Printer group: Select the groups of printers to be included in the report.
Period: Select the time period to be covered by the report.
Table
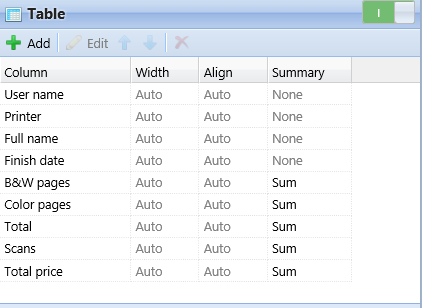
Here you can enable and disable the table option.
You can also add and remove columns to the table, edit them and change their order. For each column, you can change the width, alignment and the type of summary that will be shown on the final (bottom) row (Sum, Average or None).
To add a new column, click +Add. To open the editing options of an existing column, double-click it (or select it, and then click Edit). To remove a column, select it and click X. To move a column up or down the order, select it, and then use the up/down arrows.
Some reports do not include the option to use tables and their data can be displayed only in the chart form.
Chart
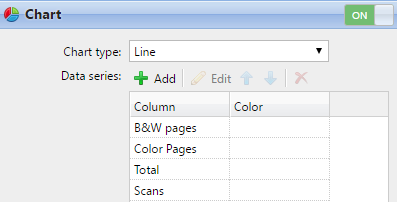
Here you can enable and disable the chart option.
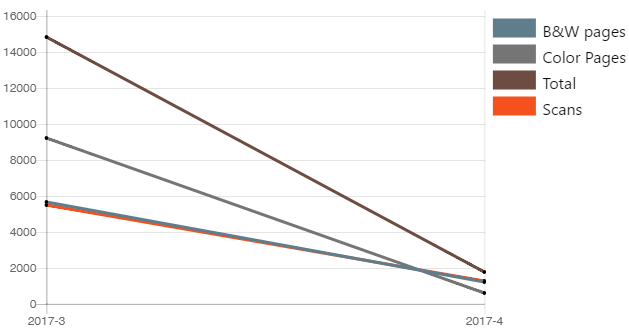
You can also select from the Bar, Line, Pie and Doughnut chart types. Furthermore, you can add and remove data types to be shown on the chart and select colors for each data type.
To add a data type, click +Add. To open editing options of a data type, double-click it (or select it, and then click Edit). To remove a data type, select it and click X. To move a data type up or down the order, select it, and then use the up/down arrows.
Some reports do not include the option to use charts and their data can be displayed only in the table form.
Designing your own reports can be a bit tricky, since it always depends on many factors - amount of data included (columns), length of column names and values, report orientation etc. To get the best result, you can click Preview anytime during the report's creation to check what the new design will look like. Only after you are satisfied with the layout, click Save to save the report.
Generating reports
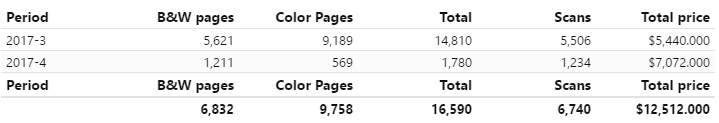
To preview a report
Select the report and click Preview (or right-click it and click Preview on its shortcut menu). The report is shown in HTML format and the number of included data is limited.
To run a report
Select the report and click Run. (Or right-click it and click Run on its shortcut menu). The report runs in the specified format (PDF, CSV, XML, XLS or ODS) with no data limitation.
To export the displayed report
After the report is generated, click one of the format buttons on the bar at the top of the report screen to download it.