Alerts and Maintenance Reports
The reports included in the Alerts and Maintenance category are:
Counter Analysis
Device alerts
Event History
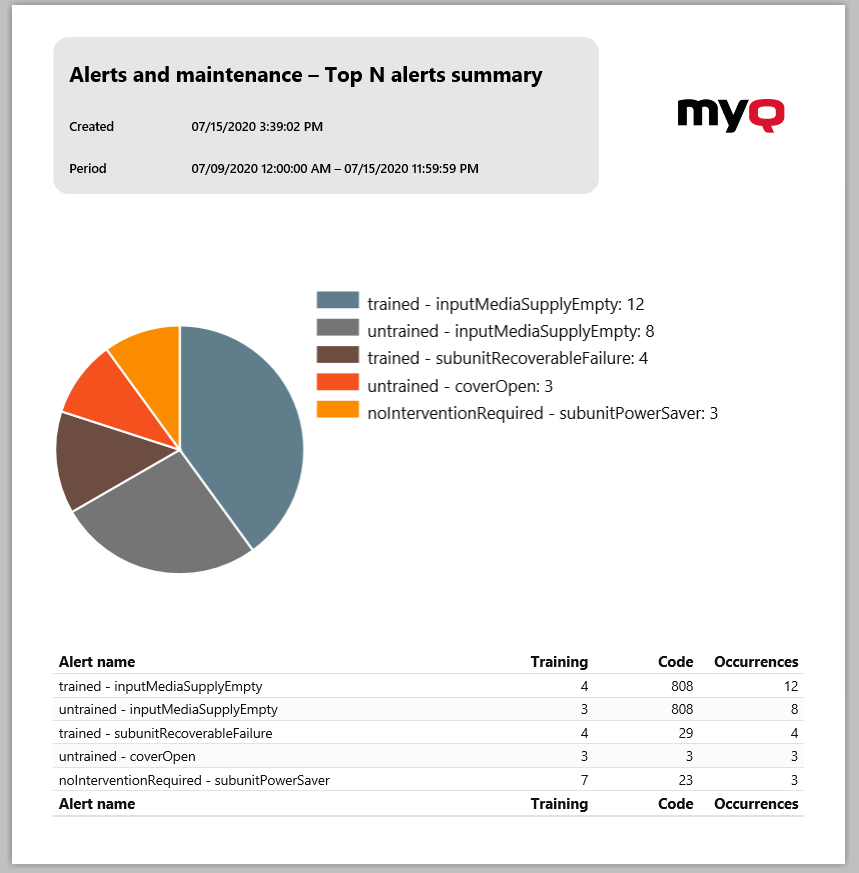
Top N alerts summary
Parameters, filters and columns available:
Name | Parameters | Filters | Default Columns | Group by |
|---|---|---|---|---|
Counter Analysis | Period | Printer name | Printer name | User name |
Device Alerts | Period | Printer name | Alert training level | Printer name |
Event History | Period | Event name | Event name | |
Top N Alerts | Period | Printer name | Alert name | Alert name |
The above reports don't support aggregate columns.
Charts are not available, except for the Top N alerts summary report where a Pie, Doughnut or Bar chart can be selected with the Alert name and Occurrences values.