
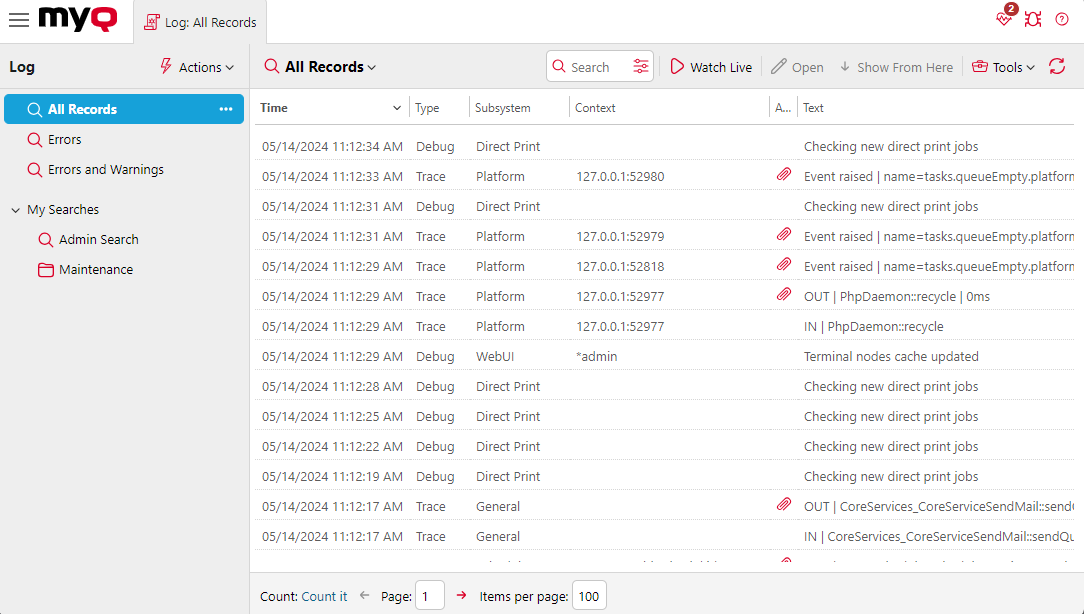
MyQ Log
In the MyQ server log, you can find information about all parts of the MyQ server: the MyQ server, MyQ Web UI, etc. Log messages are sorted into these types Critical, Error, Warning, Info, Notice, Debug, Trace and you can select the types that you want to be displayed.
You can also set the log to display only messages informing about specific MyQ subsystems, such as the Web UI, remote printer setup, user sessions on MyQ terminals, and also about a specific context, for example, direct printing or a specific printing device.
The log is updated in real time, but you can pause it by clicking Watch live, and filtering to show messages from a specific time period, such as yesterday, this week, last week, last X hours, last X weeks, etc.
Opening the MyQ Log
On the MyQ Web User Interface, go to MyQ, Log, or on the Home dashboard, click Log on the Quick links widget.
Pausing/Refreshing the log
To pause or resume the real time run of the log, click Watch live on the bar at the top of the Log tab. To refresh the log to the current moment, click Refresh on the same bar.
Filtering the log: selecting time period, types of information, subsystem or context
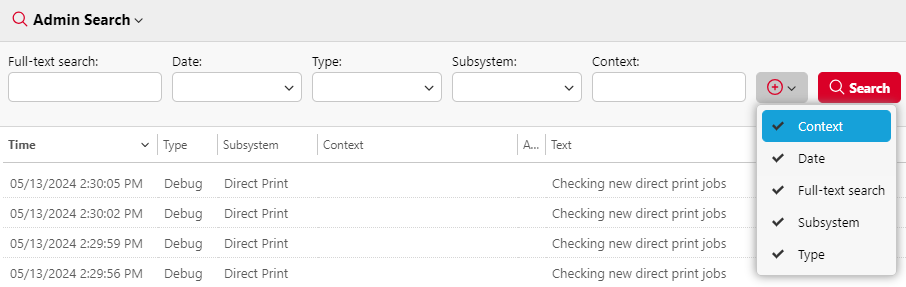
You can filter the log on the panel:
After you pause the log, you can select the period in the Date combo box.
The types can be selected and deselected on the panel at the right side of the Log tab.
In the Subsystem combo box, you can select/type one or more subsystems to be displayed in the log.
In the Context text box, you can type the context you want to view.
After the filters are set, click Search to submit them.
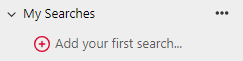
My Searches
You can use My Searches to save filters and common searches for future use. Saved searches can be shared and organized into folders. It is also possible to share an entire folder of saved searches. To create a saved search:
Click Add your first search or use the context menu and select Add search (if saved searches have already been created.
Enter a name for your search and edit the search filters as required, particular filters can be turned on or off using the + icon.
Once a search has been created the following options are available using the context menu next to the search name:
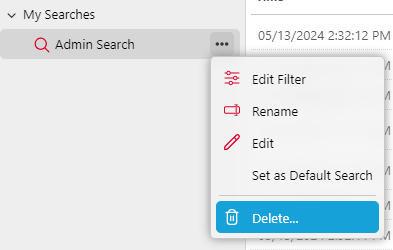
Edit Filter: displays the filter editor for the search.
Rename: allows the user to rename the search.
Edit: opens advanced properties in the right panel including sharing options.
Set as Default Search: sets the search as the default one.
Delete: deletes the search.
Exporting the log/Generating support data
Click Tools on the bar at the top of the Log tab, and then select one of the following export options:
Save as Excel — export the log as an Excel file.
Save as CSV — export the log as a CSV file.
Generate Support Data — generates a .zip file with multiple files for MyQ support.
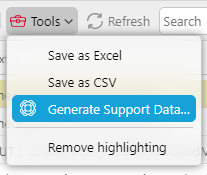
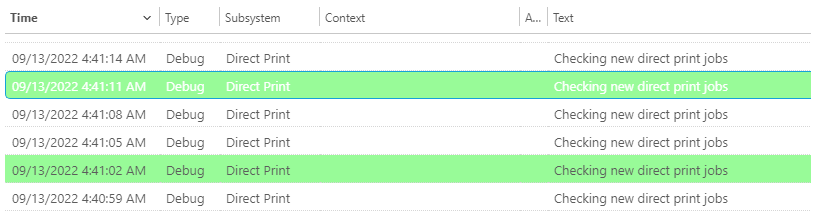
Highlighting log messages
You can highlight particular log messages. To do so, select the message that you want to highlight and then press the SHIFT + SPACE keyboard shortcut.
To remove all highlights, click Tools on the bar at the top of the Log tab, and then click Remove highlighting.